

How to Choose Robotic Gear for Your Business in 2026?
Choosing Robotic Gear in 2026 is less about buying the most advanced machine and more about matching equipment to real work. Joseph Engelberger, widely regarded as a pioneer of industrial robotics, is often quoted as saying, “I can’t define a robot, but I know one when I see one.” The line is memorable, but buying decisions need more than recognition. They need clear measures.
Start with the task. Will a robot move cartons, inspect small components, or assist workers with repetitive assembly? Record the payload, reach, cycle time, and hours of operation. A robotic arm that handles a 12-kilogram part may struggle when a longer gripper adds weight. Measure the workspace, too. A few centimeters can decide whether equipment fits beside a conveyor or blocks a service aisle.
Then test the whole system. That includes grippers, sensors, safety features, software, and maintenance support—not just the robot itself. Ask suppliers for cycle-time results using your own parts. Check how quickly replacement components can arrive. A polished demonstration is useful. It is not proof of reliable production.
Budget for integration and training, not only purchase price. Compare energy use, maintenance needs, and expected downtime over several years. Ask who will diagnose faults at 2 a.m. Small details matter. So does operator feedback. A technically impressive system may still be awkward to clean or reset. No checklist captures every surprise; pilot testing can expose problems you did not anticipate. In this guide, we will examine practical criteria for choosing Robotic Gear, while keeping one question in view: will it make daily work safer, steadier, and measurably better?
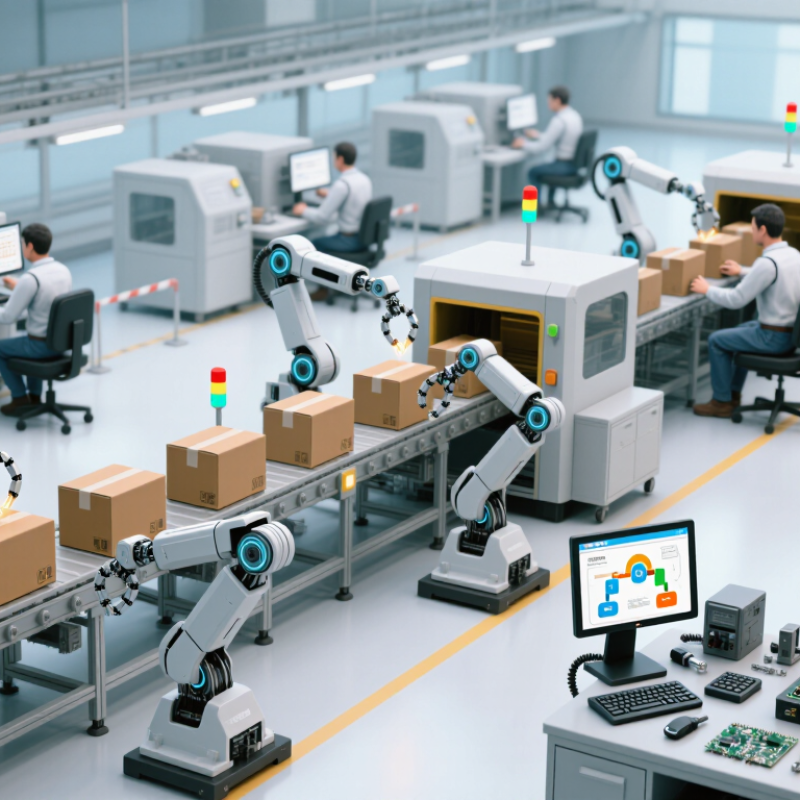
Define Automation Needs Using IFR’s 541,302 Robot Installations in 2023
In 2023, factories installed 541,302 industrial robots worldwide, according to the International Federation of Robotics’ World Robotics 2024 report. That was about 2% below 2022, yet the second-highest annual total recorded. The global operating stock reached roughly 4.28 million robots. These figures show broad adoption, not a reason to automate every task. They are a useful benchmark, not a business plan.
Start with a specific bottleneck: repeated pallet handling, a welding station waiting between cycles, or a pick-and-place task causing uneven output. Measure cycle time, changeovers, error rates, and hours spent on repetitive work. Then compare the likely gain with integration, safety, maintenance, and training costs. Small details matter. A robot may meet its target speed but still slow a line if operators need to reposition parts by hand. IFR’s global totals cannot predict your return; your product mix and floor layout can change the result. Be cautious with optimistic payback estimates. Test one representative task, record results across several shifts, and include the awkward exceptions. The data is useful, but local measurements should make the final call.
Compare Robot Types Against IFR’s 162 Robots per 10,000 Workers Benchmark
Choosing robotic equipment in 2026 starts with the work, not the headline numbers. Use IFR’s benchmark of 162 robots per 10,000 workers as a reference point for manufacturing robot density. It can show how automation compares across an industry, but it is not a recommended target for every business. Not a quota.
Match the robot type to the task. A six-axis arm can handle varied welding or machine-tending movements, while a SCARA robot suits fast, repeatable assembly on a flat work area. A delta robot may fit light picking and packing. Autonomous mobile robots can move bins between stations, but only if routes, handoffs, and floor conditions are well understood. A benchmark cannot tell you whether a narrow aisle or uneven shift schedule will cause delays.
Before buying, record cycle times, changeovers, downtime, and the minutes workers spend carrying parts. Compare those figures with a small pilot, including setup and maintenance time. If one cell needs two robots to match the benchmark, that may still be sensible; another may gain more from better fixtures or clearer task design. Measure twice. The uncomfortable part is that early estimates are often wrong. Recheck them with operators after a full production cycle, then decide whether expanding automation is justified.
Assess Safety, Integration, and Total Cost Before Comparing Vendors
Before comparing vendors, define the work the robot must perform and the people who will share its space. Map reach, payload, speed, pinch points, and the operator’s normal walking path. Watch a real shift, not just a clean demonstration. Small details matter. An experienced safety review should examine guarding, access doors, stop controls, and recovery tasks. Ask how workers will clear a jam without reaching into a hazardous area. Document assumptions; a fast cycle time is not worth an unsafe workaround.
Next, test integration against the equipment and software already on your floor. Check connections with conveyors, sensors, fixtures, and production scheduling, including what happens after a network interruption. Confirm who owns programming changes, backups, and troubleshooting after installation. Use a pilot with representative parts and shift conditions. Then measure. An integration that works only with one ideal part may create costly delays in daily production. Some early estimates will be wrong; revisit them after operators try the workflow.
Compare total cost over the expected service life, not only the purchase price. Include tooling, installation, facility changes, training, maintenance labor, spare parts, energy, software fees, and downtime. Ask for clear assumptions behind service intervals and response times. Model a slower ramp-up and a few unplanned stops. That is more realistic. Track output quality and labor changes alongside uptime, since savings can shift rather than disappear. Compare proposals using the same task, safety scope, integration boundary, and cost horizon.
Use IFR’s 4.28 Million Operational Robots to Gauge Industry Adoption
The International Federation of Robotics reported 4.28 million industrial robots in operation worldwide in 2023, a 10% rise from 2022. Its World Robotics 2024 report also recorded 541,302 new installations that year. That is a useful adoption signal. But the number is not a buying forecast: it combines different industries, tasks, and levels of automation.
For a business choosing robotic equipment in 2026, the scale suggests automation is established, not experimental. Yet adoption varies by region. Asia accounted for about 70% of new installations in 2023, according to IFR. A factory’s local labor costs, supplier access, and service capability may matter more than the global total.
Numbers can mislead.
Start with one repeatable task. Imagine a robot loading metal parts beside a machine: measure cycle time, changeover frequency, floor space, and the cost of interruptions. Then check whether the system can handle part variation and connect reliably with existing equipment. A fast robot that waits for parts is still idle. I would also leave room for doubt: pilot results rarely capture every maintenance delay or staff adjustment. Compare actual operating hours and output quality before scaling, not just the advertised cycle time.
Pilot Shortlisted Gear and Track ROI, Uptime, and Lifecycle Costs
Before choosing robotic gear, run each shortlisted option through the same real work cycle. Use a marked test area, the actual payload, and a normal shift schedule. Record completed tasks per hour, operator interventions, charging time, and safety-related stops. Keep a baseline from the current process. Small details matter: a robot that handles a smooth floor may slow down near a doorway or cable ramp. Watch it there.
Track uptime as productive operating time divided by scheduled time, and note every stoppage by cause. A single uptime percentage can hide repeated short delays. Measure labor hours saved, consumables, service visits, software fees, and replacement parts. Compare these costs with the pilot’s output, not a sales estimate. One practical check: if a unit is unavailable for 12 minutes each shift, calculate the lost capacity across a full month. That number may change the business case.
Lifecycle costs deserve a longer view. Ask how batteries, sensors, and controllers are inspected, repaired, or replaced, and include staff training in the budget. Keep a simple log with dates, fault codes, repair time, and parts used. Our first forecast may still be wrong. Pilots rarely capture every seasonal change or awkward exception. Extend the trial when results vary, and let operators explain what the dashboard misses. A gear choice should earn its place through repeatable performance and costs your team can verify.